Real Estate Prediction
Abstract—The real estate business is a difficult market to understand, but can return very high profits with the right techniques. People spend years in the market to gain the necessary experience to be able to evaluate a property and assess its price based on several factors, those factors have to be extracted from big datasets. This report aims to show an approach to automate that process, the algorithm should extract the important factors and apply them to new data to predict the prices of the new properties without human assistance. This project was divided into several parts, first the data are collected from the City of Edmonton, then these data are scanned, grouped, and prepared for classification. The next step was to use unsupervised learning clustering techniques to divide the data to classes according to the patterns or groups existing in the data. The last step was to apply supervised learning by using decision trees and ensemble bagged trees to predict the classes of the new data. By the end of this project, the results are interpreted and the workflow of how each technique was used to perform prediction through classification is explained.
Data
- Property Assessment Data: This dataset has detailed information for each property, including its address, coordinates, assessed price, and other classification features. This dataset was the focus of this project and other datasets added additional information to it.
- Property Information Data: Contains further details for most of the properties in the first dataset, including lot sizes and the actual year of build.
- 2016 Census Population by Citizenship / Neighbourhood: Shows the population of people in each neighbourhood and the numbers of refugees and immigrants in that neighbourhood. Such data can show the difference between older neighbourhoods and the newer ones, as new areas are established to accommodate newcomers.
- EPS Neighbourhood Criminal Incidents: This dataset was chosen to demonstrate the effect of the crimes in a neighbourhood on the prices of the properties.
Extracted Features
- Latitude and Longitude
- Lot size
- Population
- Population ratio
- Crimes
- Street number
- Suites
- Garage
- Assessment class
Main Parts
- Labeling
- Unsupervised Learning
- Supervised Learning
- Decision Trees
- Ensemble Bagged Trees
Labeling
| Class | Min | Max |
|---|---|---|
| Class 1 | 0 | 50000 |
| Class 2 | 50000 | 100000 |
| Class 3 | 100000 | 150000 |
| Class 4 | 150000 | 200000 |
| Class 5 | 200000 | 250000 |
| Class 6 | 250000 | 300000 |
| Class 7 | 300000 | 400000 |
| Class 8 | 400000 | 500000 |
| Class 9 | 500000 | 1.5 M |
| Class 10 | 1.5 M | 10 M |
| Class 11 | 10 M | ∞ |
Results
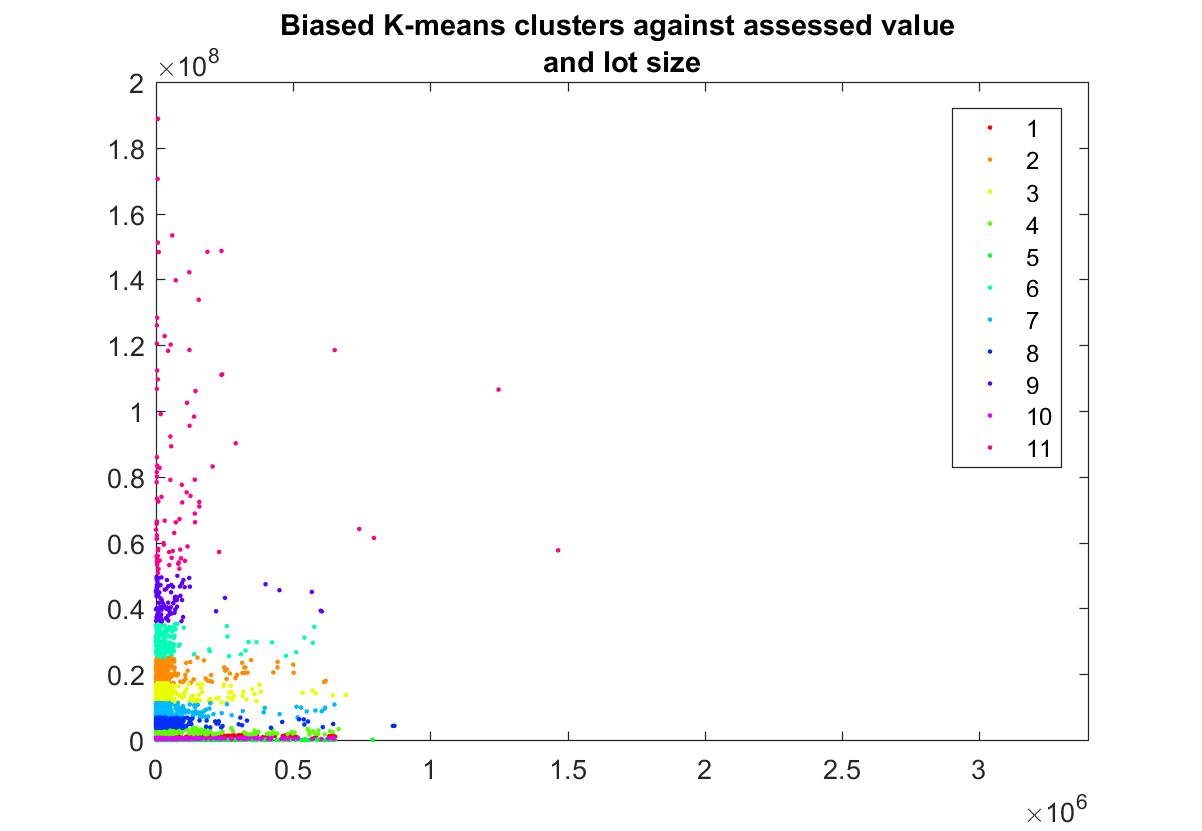
Kmeans scatter plot of the clusters against two features
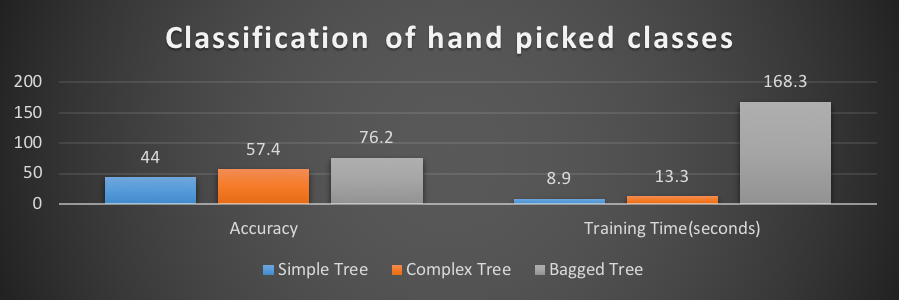
Accuracy & training time
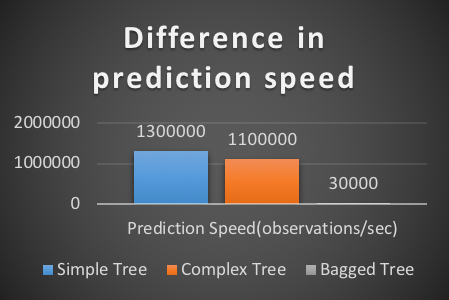
Prediction speed